

Throat Impedance

The parameters Re and Lvc approximate the voice coil impedance and represent the voice coil DC resistance (Ohm) and inductance (H), respectively. These parameters are typically provided based on measurements obtained from free-air test conditions. In practice however, the voice coil does not operate in "free-air" but within the confines of the magnetic gap of the motor. This forces the inductance of the voice coil to deviate somewhat from the inductance of an ideal inductor. Resistive losses too, are frequency dependent and increase with increasing frequency. The behavior is examined in detail by Vanderkooy [6] and Dodd [7].
The frequency dependent effects associated with the voice coil are pronounced at higher frequencies (say above about 200Hz). To account for additional, frequency dependent losses, a g-component identified as R*vc was placed in series with Re and Lvc. The functional form was relatively straightforward to derive from the resistive part of the complex impedance of the bass horn. Below 200Hz however, its effect on the simulated response is small. In the modeling results I'll show how the R*vc element alters the predicted response.
The functional form of the voice coil resistive losses, expressed as an admittance, is shown below. The fitting parameters, like the functional form for the radiation resistance, allows the modeler to "fine tune" the real part of the simulated response to the corresponding real part of the measured response.

The fitting exponent, m, varies between 0.5 and 0.8, R*o represents the resistance increase associated with frequency dependent losses at a frequency, fo which, for the case of the K33E, is about 3.3 Ohms at 1000Hz.
The revised Beranek model, incorporating the g-component elements, becomes
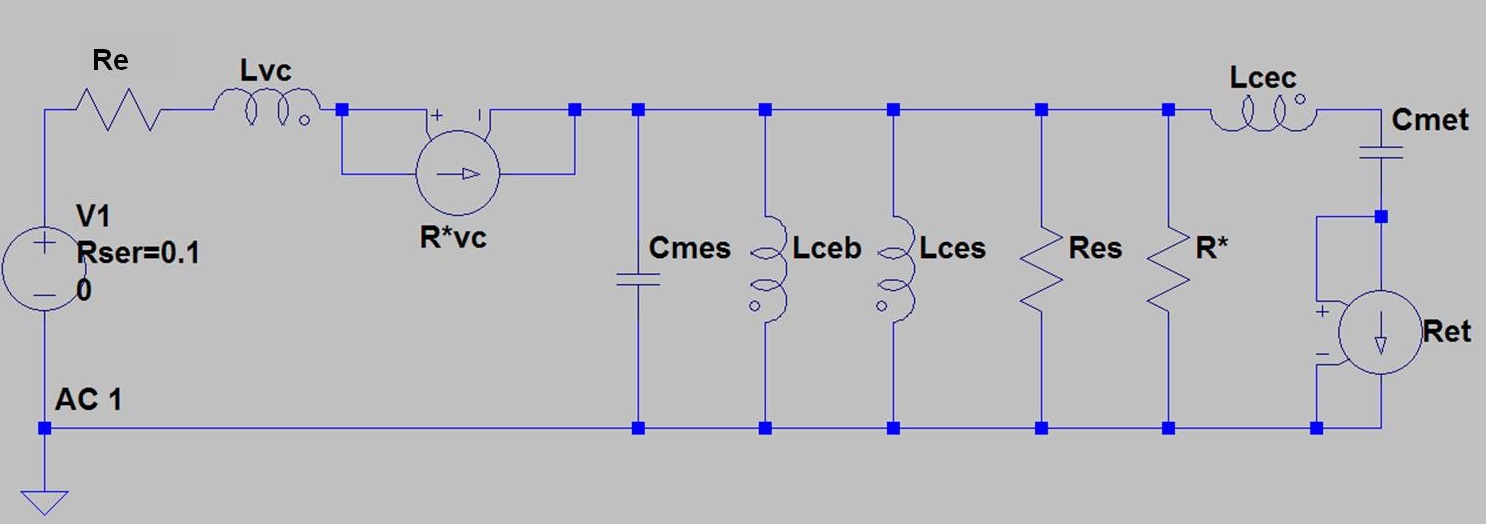
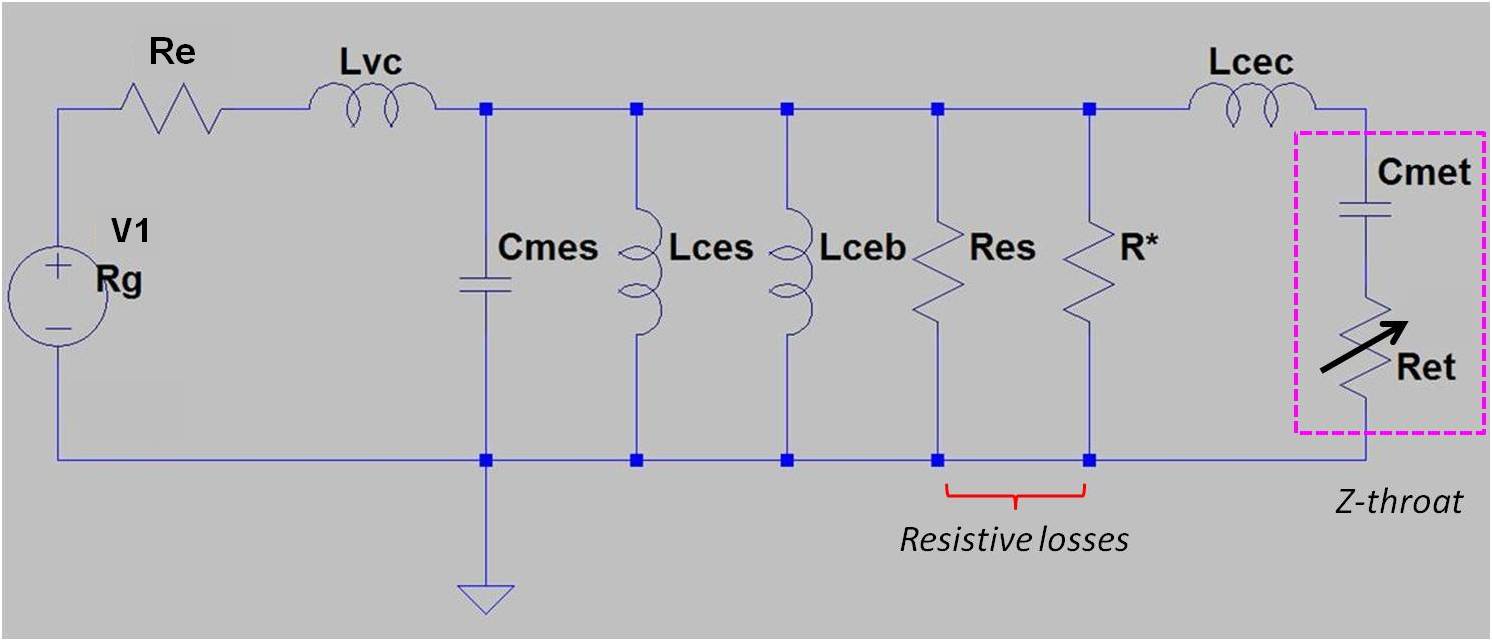
The schematic is the proposed equivalent electrical circuit model assumed for the Klipschorn bass horn.
MEASUREMENTS
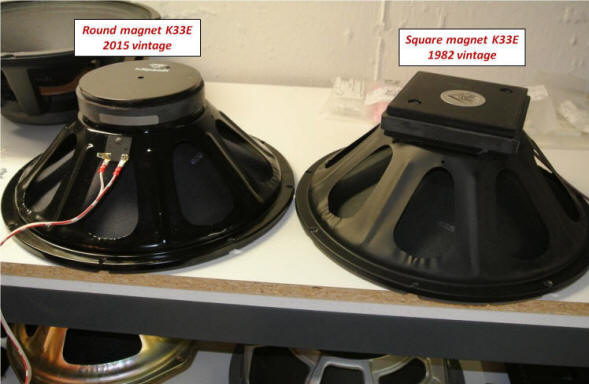
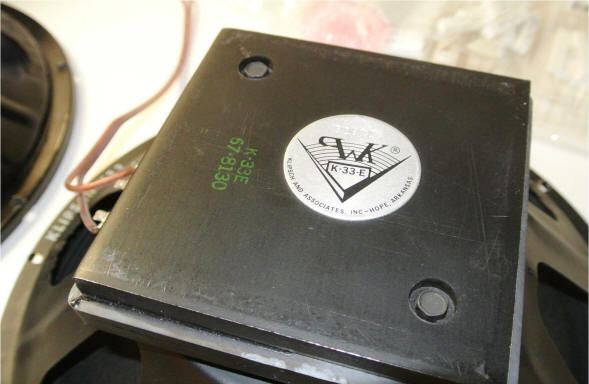
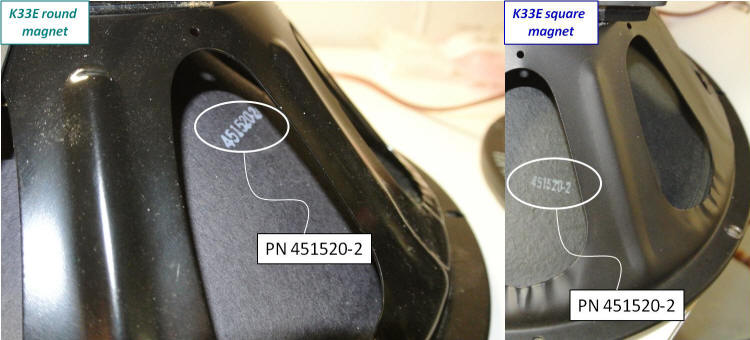
K33E Square and Round Magnet Drivers
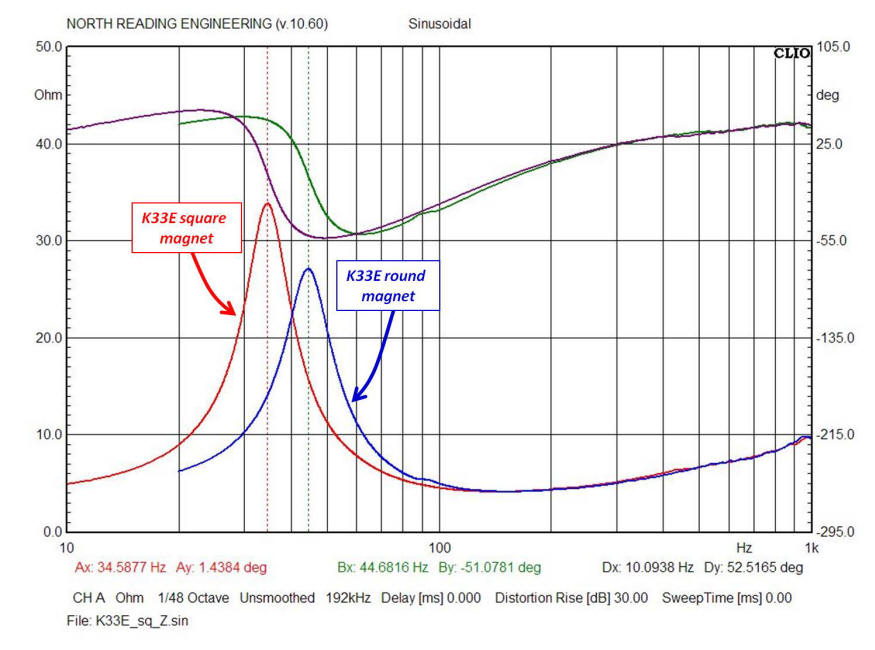
First, let's consider the impedance of the K33E drivers and measure how the impedance is changed when the drivers are loaded into the Klipschorn bass horn. The series of plots shown below will be the data used to develop the component magnitudes shown in the equivalent electrical circuit model.
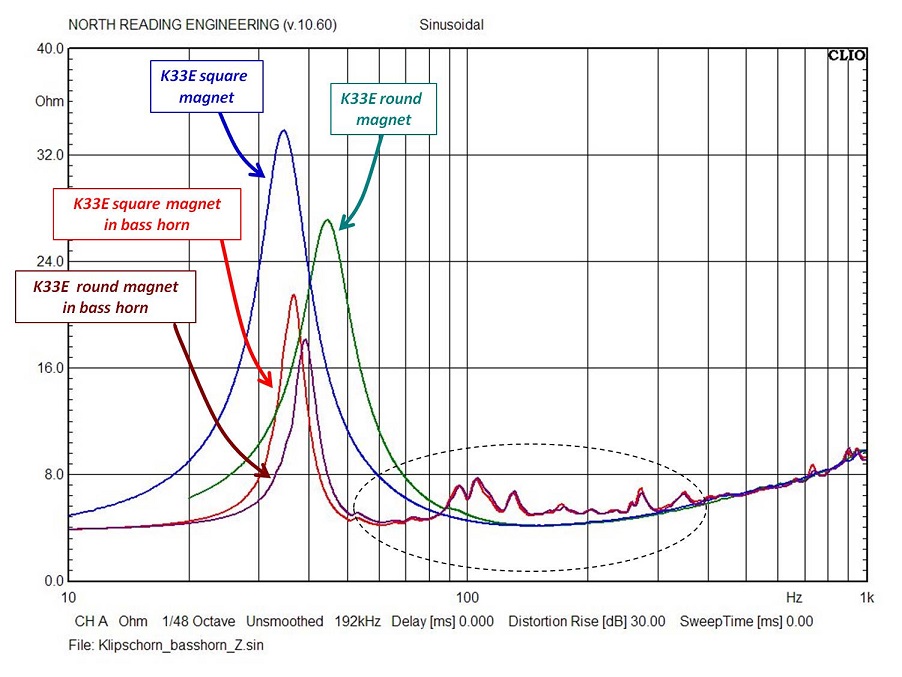
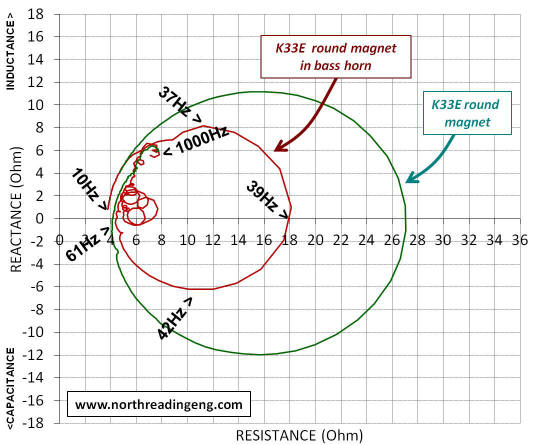
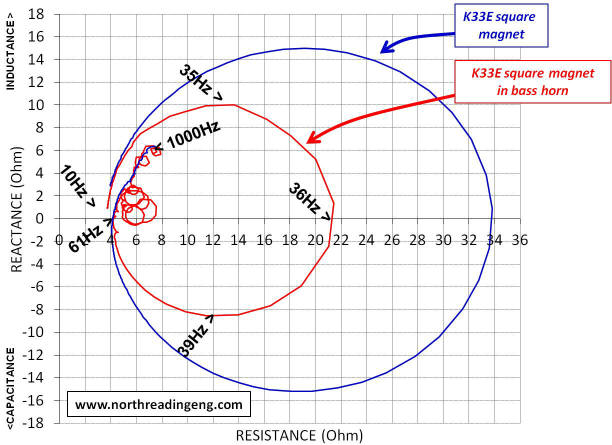
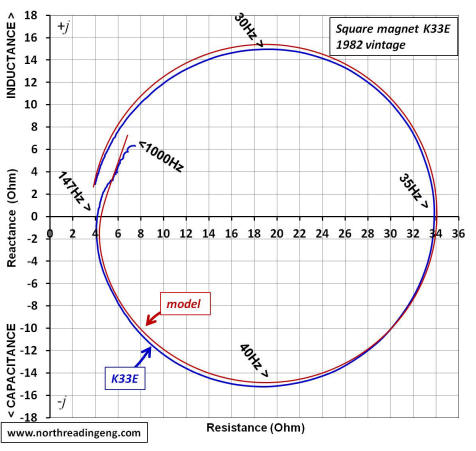
The first plot shown above is the impedance magnitude of the two versions of the K33E shown earlier. Super-imposed is the impedance magnitude plot of each driver operating in the bass horn. Note how the large frequency response peak changes in size between the free-air and horn loaded responses. The dashed ellipse highlights the bandwidth (~50 to 400Hz) where driver output sensitivity is enhanced, i.e. the frequency range where the horn "loads" the driver by the effect of a significant increase in radiation resistance, Ret. The two plots below are the corresponding Nyquist plots of each driver operating in free air and then operating after installing into the bass horn.
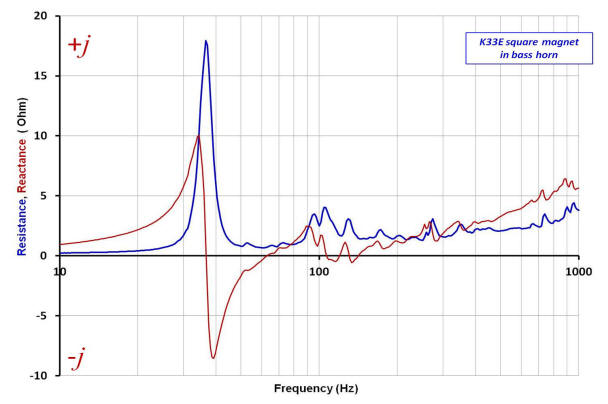
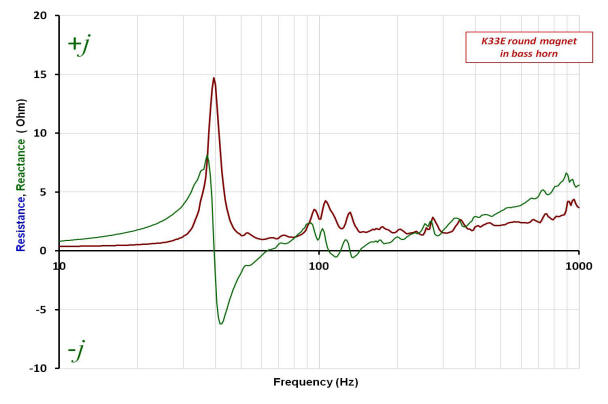
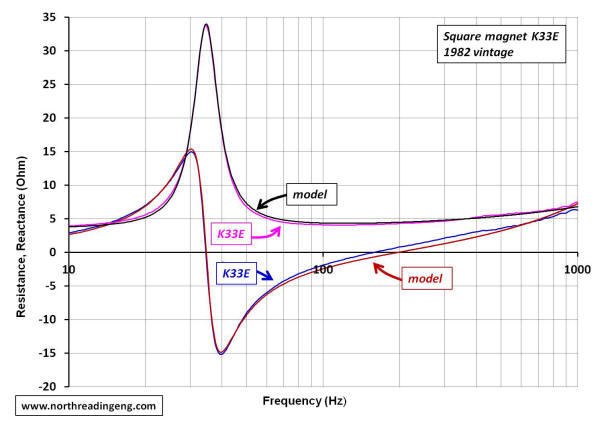
Below is a plot of the reactance (imaginary part of the complex impedance) and resistance (real part of the complex impedance) as a function of frequency of both K33E drivers operating in the bass horn.
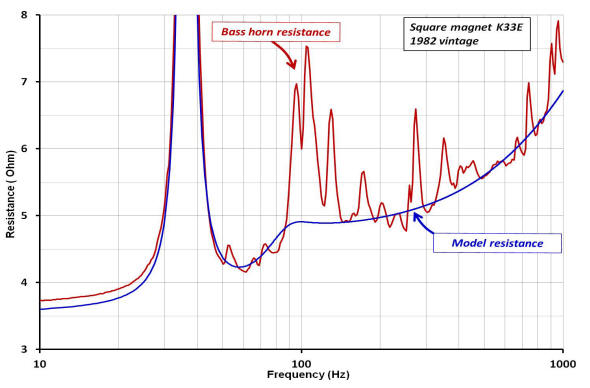
An over-plot comparing the resistive part of the impedance, shown above for each driver, is plotted below.
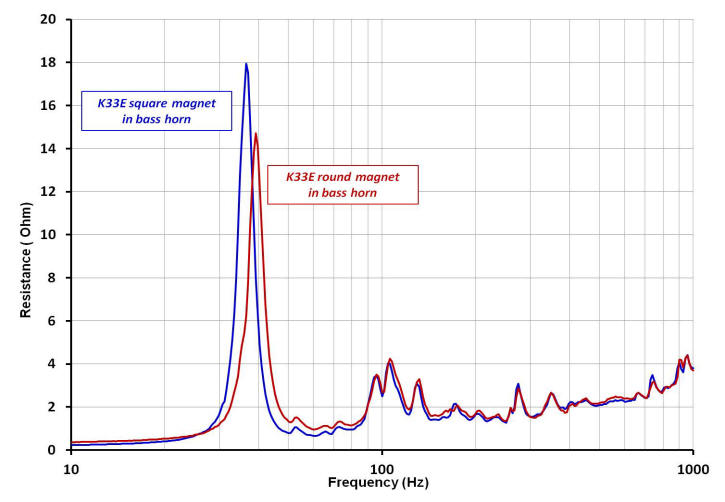
The accuracy of the simulations will be assessed based on how closely the model can replicate the measured responses shown.
K33E SQUARE AND ROUND MAGNET EQUIVALENT CIRCUITS
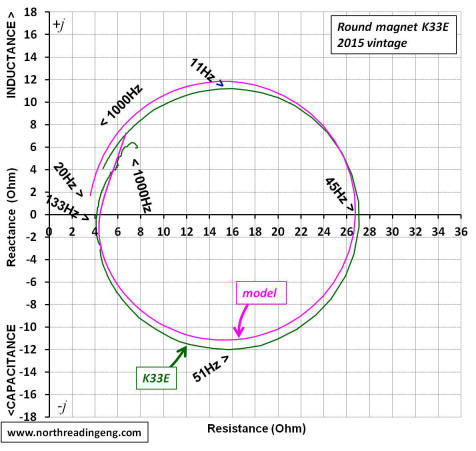
The plots shown below compare the simulated complex impedance of the K33E round and square magnet drivers to the measured responses. Four plots are provided in the comparison, the impedance modulus, the real part, the reactive part and the Nyquist plot. The schematic of the electrical equivalent circuit used to simulate the responses for each driver are also shown. The electrical capacitance due to the driver mass, Cmes, and the electrical inductance due to the driver suspension, Lces, were derived from the compliance and BL-product magnitudes provided in the table above. The resistive losses at resonance, Res, were determined by iteration. The functional form of the frequency dependent part of the voice coil impedance is shown as the g-component, R*vc.
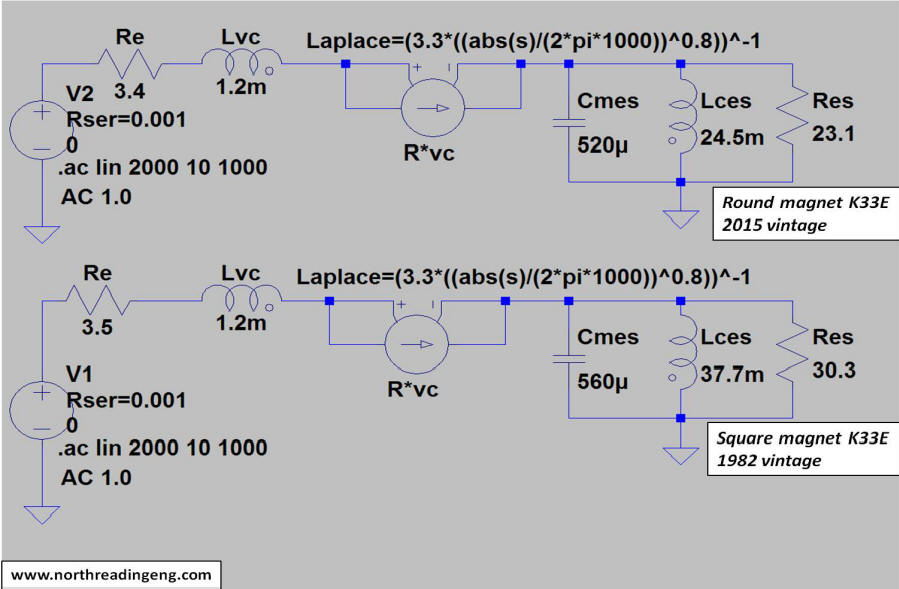
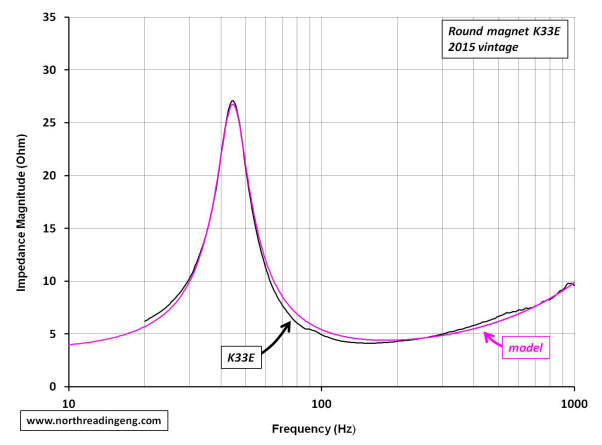
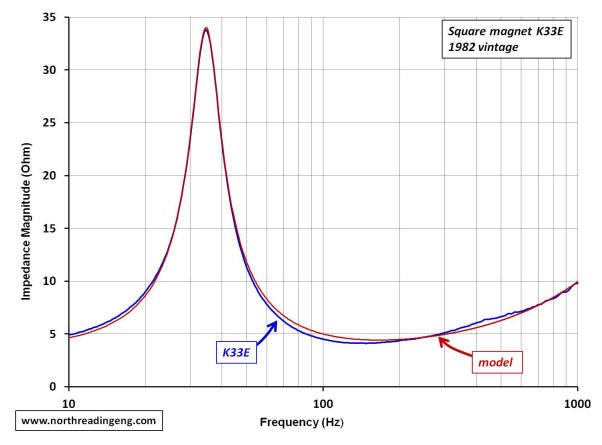
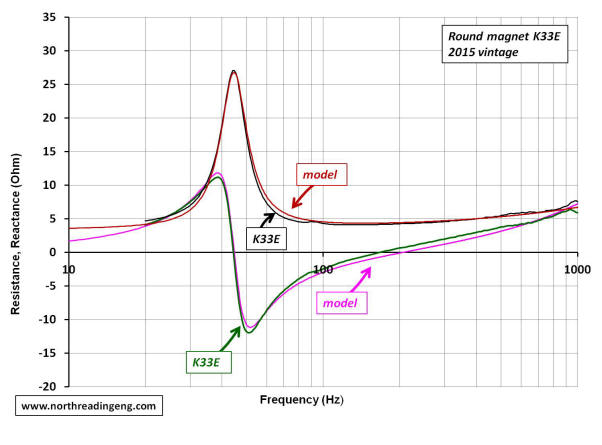
With both real and reactive components derived from the complex impedance, the Nyquist plot comparing simulations to the measured responses can be made. As evidenced in the plots, the model component magnitudes shown in the schematics do a reasonable job of predicting the free-air response of each driver.
KLIPSCHORN FOLDED BASS HORN ELECTRICAL EQUIVALENT CIRCUIT
With values for the driver Re, Lvc, Cmes, Lces, Res and function form for R*vc assigned, the remaining component values of the electrical equivalent circuit for the bass horn are determined. The SQ magnet K33E driver is considered first and its parameters given below,
 .
.
How the values were determined is now discussed.
SOLVING FOR Lceb, Cmet AND R*
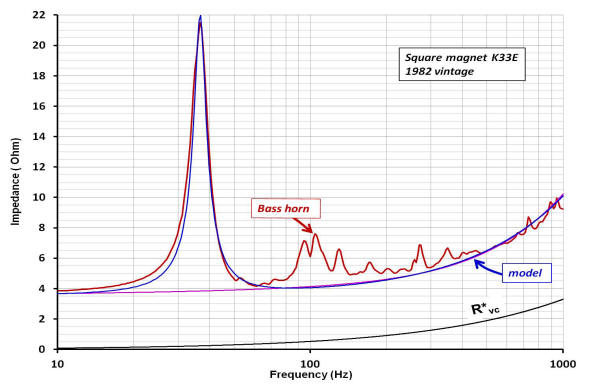
The components Lceb, Cmet and R* determine how the driver free-air resonance peak is changed by horn loading. To determine the component values used in the simulation, a curve fitting routine comparing the real and reactive parts of the measured impedance to the real and reactive parts of the model impedance was used. For this step, the elements comprising Lcec and Ret are short circuited. The plot on the left is the impedance magnitude of the model with the component values for Lceb, Cmet and R* that provide the best fit to the large resonance peak measured in the horn response. The plot also shows how the functional form of R*vc contributes to the resistive part of the curve. For this situation, the simulated reactance is super-imposed over the measured reactance and shown at the plot to the right.
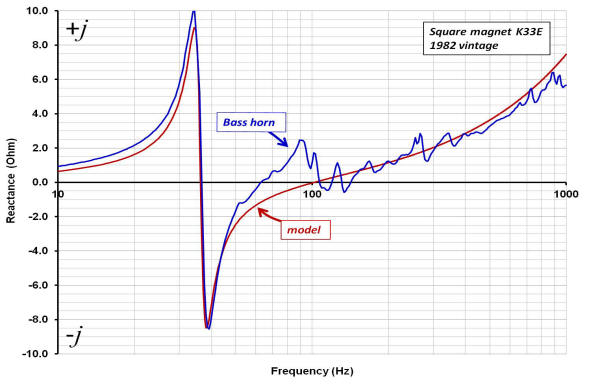
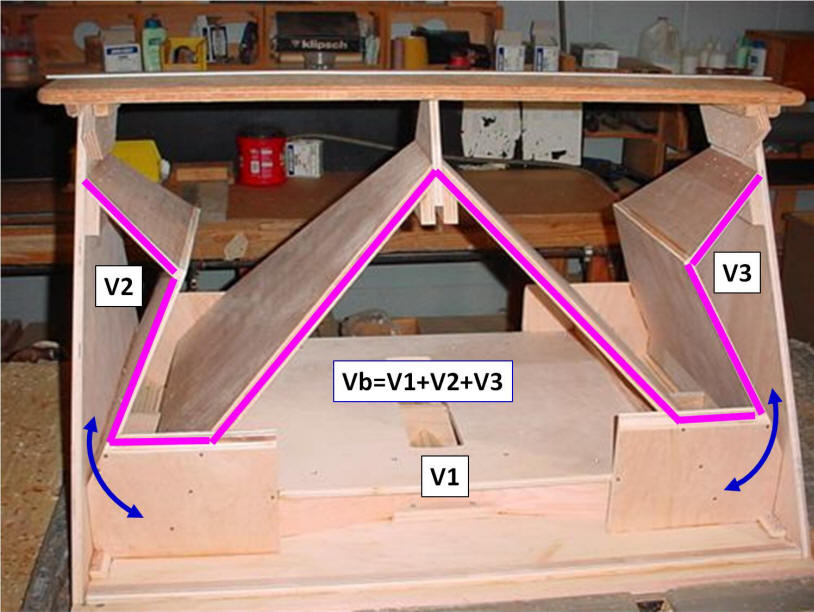
An approximation for the back chamber volume, Vb, can be determined directly from the simulation derived value of Lceb using the following relationship:

which yields a value for of 0.867m3 or about 3.0ft3. Since Vb is a constant, the ratio Lceb / BL2 must also be constant. Thus, the magnitude of Lceb is directly proportional to the BL-product of the motor assembly. Note that discrepancies between the calculated volume of the rear chamber and the actual volume are likely. Causes include measurement errors associated with obtaining driver electro-mechanical parameters and the accuracy of the fitting routine used to fit the model simulation to the measured response.
By appropriate substitutions, the relationship is also used to correlate the front chamber volume, Vf, to the magnitude of Lcec.
SOLVING FOR Ret
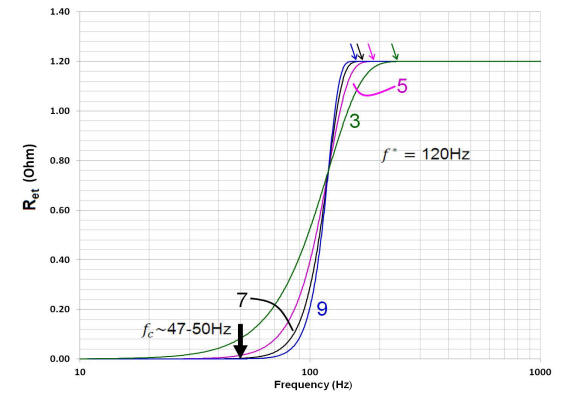
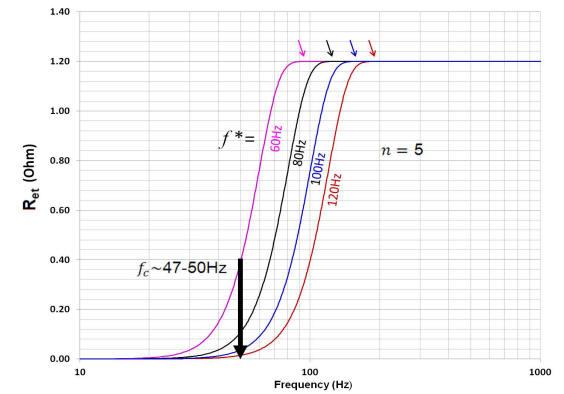
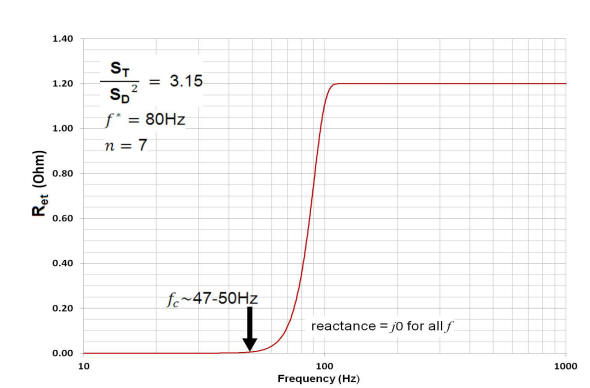
Next, the n and f* parameters that best fit the functional form of the radiation admittance, 1/Ret(abs(s)), to the resistive part of the throat impedance are determined (the frequency range identified earlier by the dashed ellipse, see above). For this step, the element comprising Lcec shorted. The lower left plot shows how the contribution of the functional form of the model radiation resistance alters the model impedance shown above. In the plot right, the measured reactance is compared to the simulated reactance.
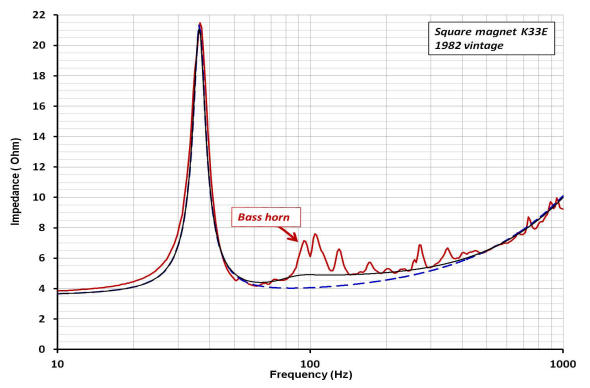
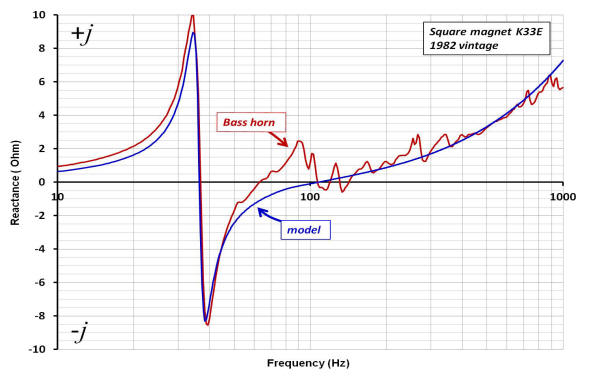
A plot of Ret as a function of frequency used is shown below, left. On the right is a closer look at the relationship between the model radiation resistance and the measured response.
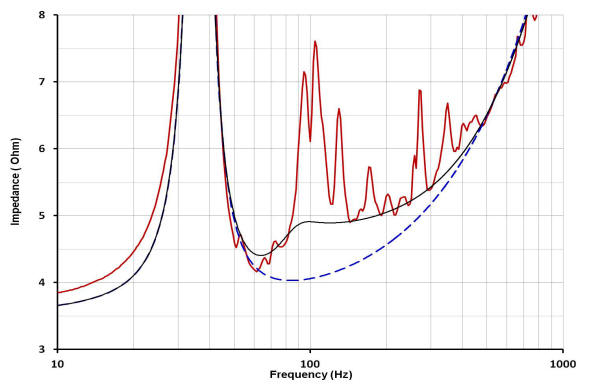
In the plot below, the real part of the model impedance magnitude shown upper right, is super-imposed over the real part of the measured, complex impedance of the bass horn response. As is evident in all of the plots, the model does not capture the reflections seen in the actual response (the peaks seen in the red measured response plot).
SOLVING FOR Lcec
The last element to consider is the magnitude of Lcec. To get some sense of the effect Lcec has on the both the simulated impedance and equivalent electrical power dissipation across the Ret, the model was run over a range of Lcec values shown in the plots. The result of the simulation series is shown below.
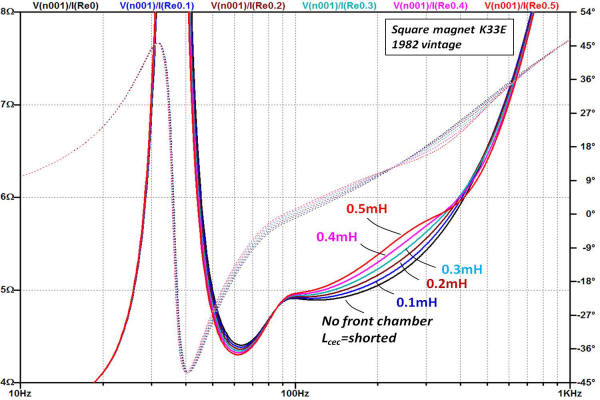
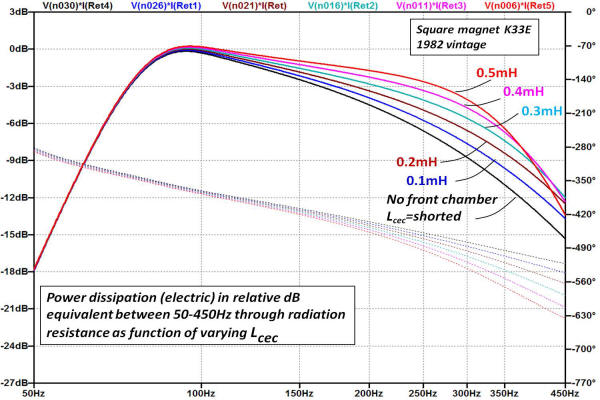
As seen in the left plot, the volume of the compression chamber between the front of the cone and the throat baffle effects the magnitude of the impedance between 100~400Hz. By examination of the electrical equivalent circuit, Lcec is a -6dB/octave low-pass filter with the throat impedance as a load. As shown in the frequency response plot at right, increasing the magnitude of Lcec (i.e. increasing the volume of the front chamber) enhances horn output to about ~350Hz (whether this revision to the horn is realized experimentally I will leave to others to verify experimentally).
The best fit to the experimentally measured impedance was determined to occur at Lcec ~0.1mH which correlates to a front chamber volume of 0.0008m3 or about 0.03ft3 (50in3). The simulation shows that power dissipation across the radiation resistance at 450Hz is about -12dB relative to the radiated power at 100Hz for Lcec =0.1mH. Note that the expression shown earlier correlating Lceb to Vb is the same used to solve for the the volume equivalent of Lcec.
PUTTING IT ALL TOGETHER
K33E Square Magnet Driver
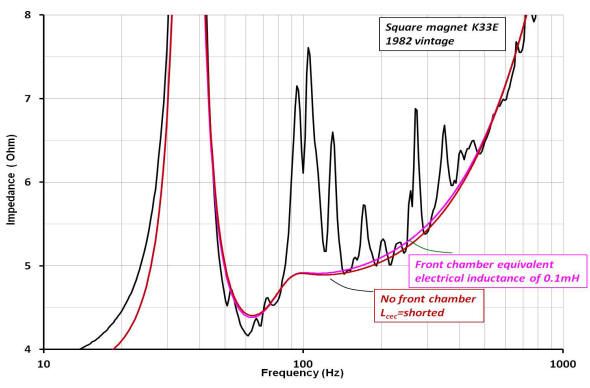
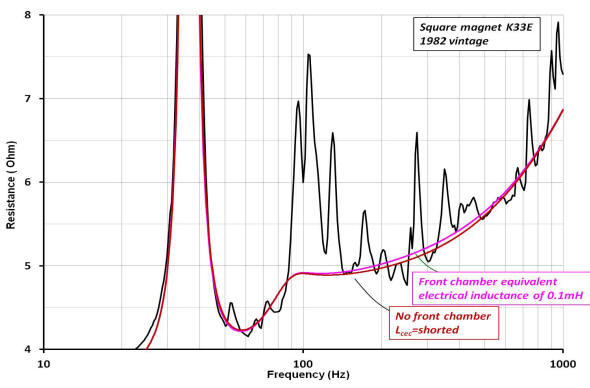
With each component in the electrical equivalent circuit assigned either a value or functional form, the impedance response is plotted and compared to the experimental results obtained for the SQ magnet K33E. Lower left, the impedance magnitude of the bass horn is compared to the simulation at two values of Lcec. At right, a comparison between the real part of the simulation (same values of Lcec) and the real part of the experimentally determined complex impedance.
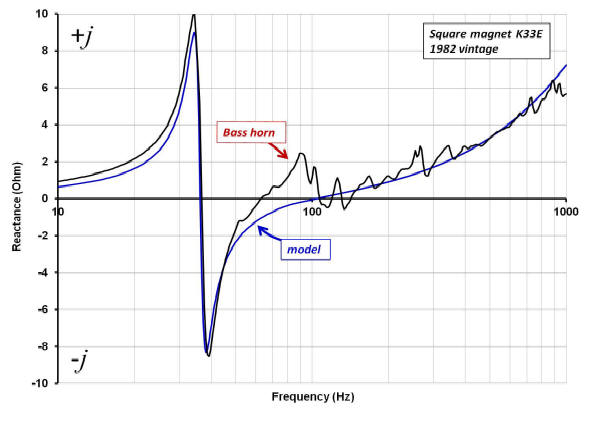
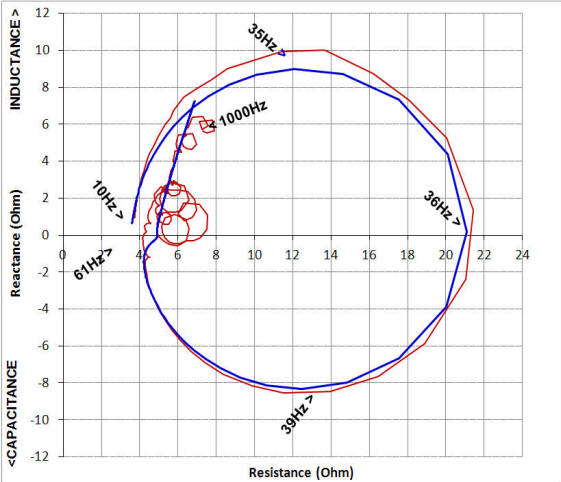
The horn simulated reactance with Lcec equal to a 0.1mH inductor is plotted over the actual reactance of the horn, below left. Lower right is a Nyquist plot of the complex impedance of the horn (red) with the simulated (blue) complex impedance super-imposed.
Predicted Sound Pressure Level Response
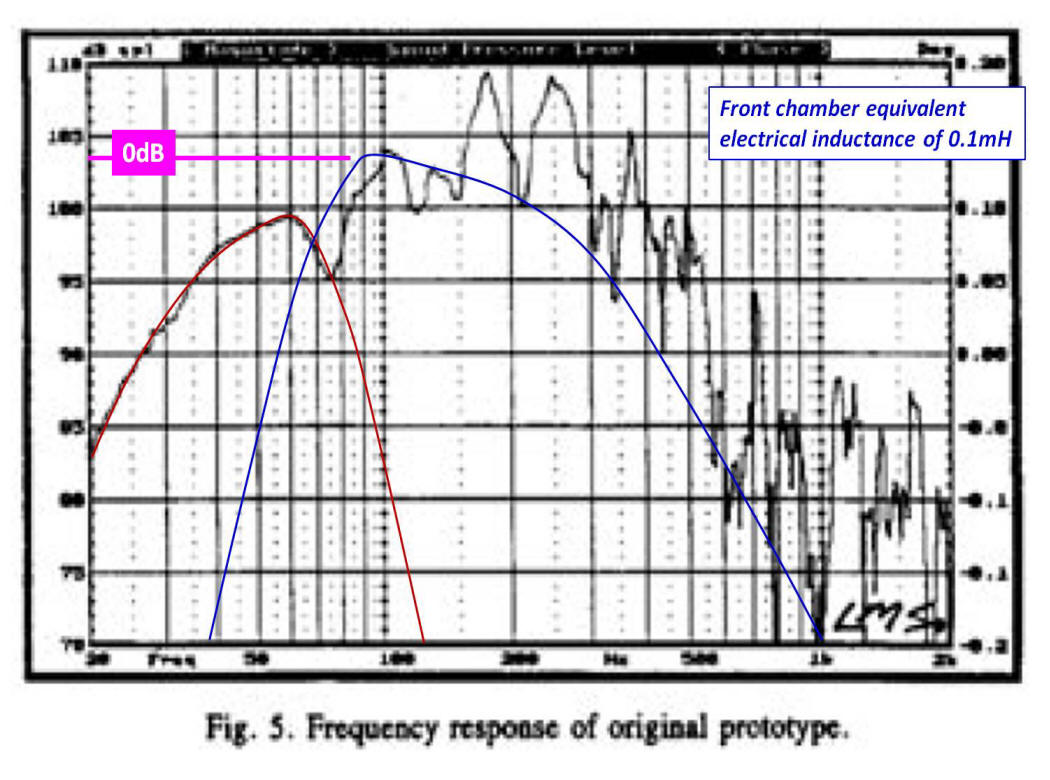
Below shows a plot of the factory measured anechoic frequency response of the Klipschorn bass horn. The plot is taken from [8]. Super-imposed over the frequency response of the factory horn is the predicted frequency response of the horn based on the model (blue). The predicted response is the electrical power dissipation across Ret. Note that a significant amount of the output is related to reflections not considered in the functional form representing Ret. The dark red plot is the output of the K33E operating as a large woofer in a sealed enclosure. Note that the red plot is not a model result; I simply traced out the response of what I believe is the response of the system below the horn cutoff frequency based on the measured response.
K33E Round Magnet Driver
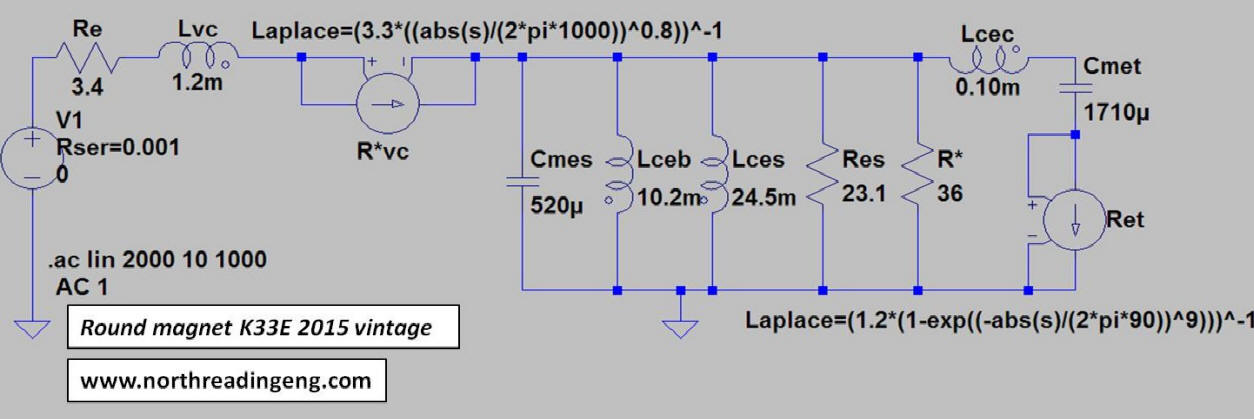
The complete equivalent electrical circuit for the bass horn with the RD K33E magnet driver is shown in the schematic below.
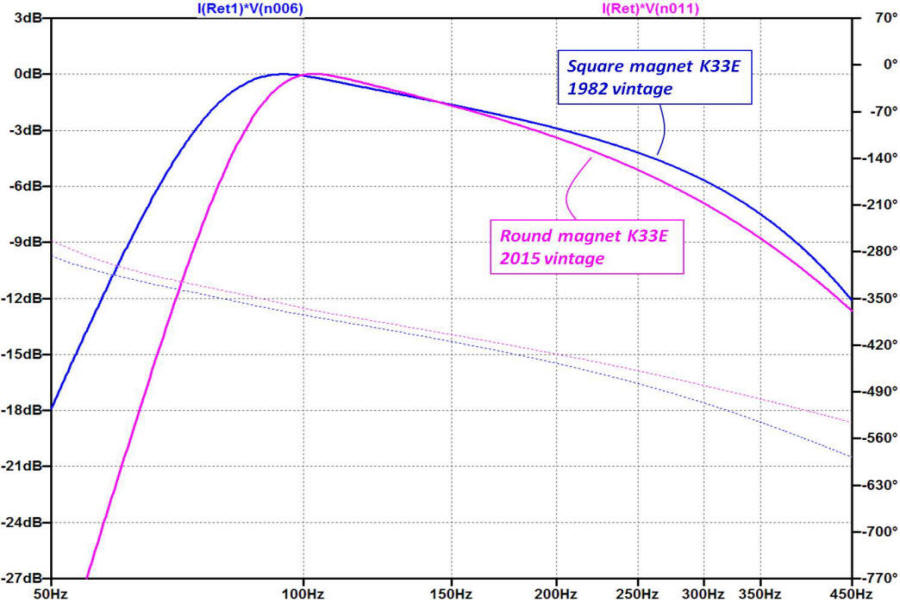
A comparison between the round magnet frequency response simulation and square magnet is shown for Lcec =0.1mH. The model predicts that the low frequency response of the horn is extended by using the SQ magnet driver and, given the difference measured in the compliance between the two drivers, a result that should not come as a surprise. As the suspension compliance of the RD magnet driver increases over time by use (i.e. the so-called break in), the low frequency response should improve. It may also suggest that the factory response plot shown above was taken with a new, high compliance, RD magnet K33E.
Enlarging the Rear Chamber
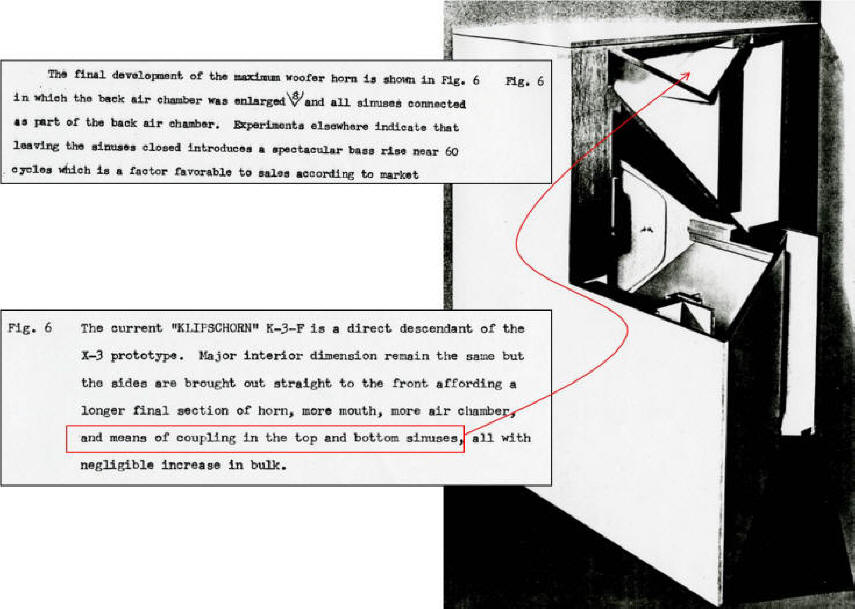
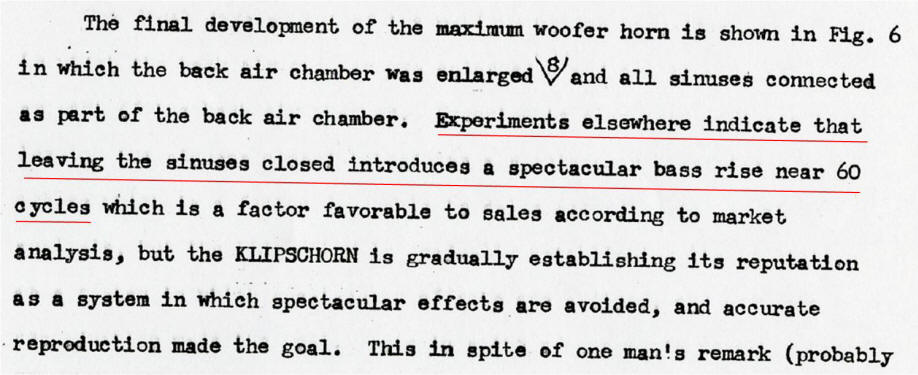
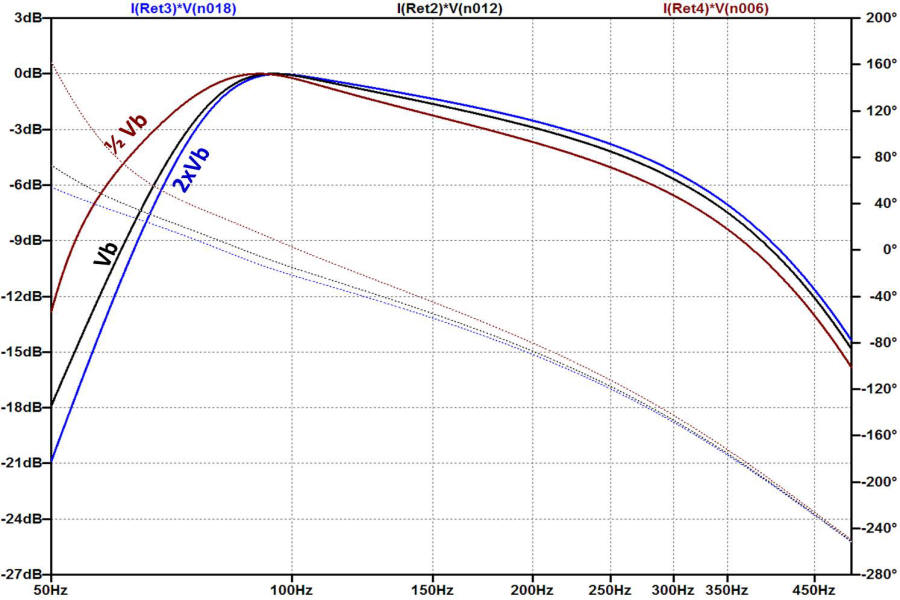
Getting back to Mr. Klipsch's question of enlarging the rear chamber, Vb. From the same unpublished manuscript discussed at the top of this page, Klipsch writes:
 .
.
In the plot below, the electrical power dissipation (in dB equivalent) for three rear chamber volumes is shown. The model predicts that reducing Vb by 50% does increase output near 60Hz as Klipsch states. In the acoustic domain, the response may be associated with a peak between 50 and 90Hz and thus yielding the "spectacular bass rise".
REFERENCES
1. R. Small, Direct-Radiator Loudspeaker System Analysis, IEEE Transactions on Audio and Electroacoustics, Vol. AU-19, pp.269-281, 1971
2. L.L. Beranek, Acoustics, Published by the American Institute of Physics for the Acoustical Society of America, p.262, 1986 Ed.
3. D.B. Keele, Jr., Low-Frequency Horn Design Using Thiele / Small Driver Parameters*, AES preprint no. 1250, 1977 (*presented at the 57th Convention May 10-13, Los Angeles, CA 1977)
4. P.W. Klipsch, A Low Frequency Horn of Small Dimensions, Journal of Acoustical Society of America, p.138, Vol. 13, October, 1941
5. D. J. Plach and P. B. Williams, Reactance Annulling for Horn Loudspeakers, Radio-Electronic Engineering, p.15 February, 1955
6. J. Vanderkooy, A Model of Loudspeaker Driver Impedance Incorporating Eddy Currents in the Poles Structure, Journal of the Audio Engineering Society, Vol. 37, No. 3, March 1989
7. M. Dodd, W. Klippel, J. Oclee-Brown, Voice Coil Impedance as a Function of Frequency and Displacement, white paper no. 4, Klippel GmbH, Dresden, 02177, Germany (available at www.klipple.de)
8. R. Delgado, Jr,, P.W. Klipsch, A Revised Low-Frequency Horn of Small Dimensions, Journal of the Audio Engineering Society, pp.922-929, Vol. 48, No. 10, October, 2000.
Webpage content property of John Warren of North Reading Engineering, North Reading, MA 01864 USA. No part of the above work may be copied and published, in part or in total, without written permission.
© 2018 John Warren